WHERE WE WORK

MOLDOVA

OVERVIEW

Case studies Country data Macroeconomic indicators Local experts

MAJOR STRUCTURAL REFORM DEVELOPMENTS

Collapse arrow image

Reforms in the financial sector to ensure its stability continued.
To prevent migration of risks from the banking to the non-bank financial sector, the authorities have been improving the regulatory and supervisory framework for the sector. According to new regulations introduced in February 2020, the non-banking sector is not allowed to accept deposits from the general public, all entities in the sector need to report the new credit activity to the credit bureaus, and the minimum share capital is increased to MDL 1 million (around US$ 60,000) from January 2021. Prudential requirements have been enhanced and a sanctioning regime introduced. The banking sector also saw the adoption and implementation of the enhanced Emergency Liquidity Assistance to solvent and viable banks from December 2019. On the NBM’s approval of the new supervisory and management boards, a systemic bank exited temporary administration in February 2020.


Continued engagement with the IMF supports Moldova’s reform agenda.
The authorities finalized the sixth and final review under the three-year Extended Credit Facility and Extended Fund Facility arrangement with the IMF in March 2020. Negotiations for a new economic reform programme resulted in a staff-level agreement in July 2020 for a US$ 558 million three-year arrangement. When approved by the IMF Board, the new programme will support the Moldovan authorities in advancing institutional reforms aimed at tackling vulnerabilities in fiscal governance, non-bank financial sector oversight, market regulation, anti-corruption and the rule of law.


Finalization of the Ungheni-Chisinau gas pipeline increases Moldova’s energy security.
The inauguration of the 120-kilometre-long Ungheni-Chisinau gas transmission pipeline in August 2020 marks the completion of the second stage of the Ungheni-Chisinau strategic infrastructure project, connecting the Moldovan gas network to the European Union via Romania. Construction of the interconnector between the Romanian city of Iasi and the Moldovan town of Ungheni was the first stage of the project. The Ungheni-Chisinau pipeline will add up to 1.5 bcm/year of gas supplies and support the geographical diversification of natural gas supply routes to Moldova. This project increases Moldova’s energy security, because up until now the country has been nearly fully dependent on Russia for the import of gas.


A new customs code was adopted.
The new code merges three laws into a single legal act in an effort to systematize and streamline the previous customs legislation. It also aims to liberalize and simplify certain customs procedures as well as promote the use of electronic documentation. Adopted in July 2020, the code will take effect in January 2022 with a transitional period provided for some of the articles.


CASE STUDIES

Collapse arrow image
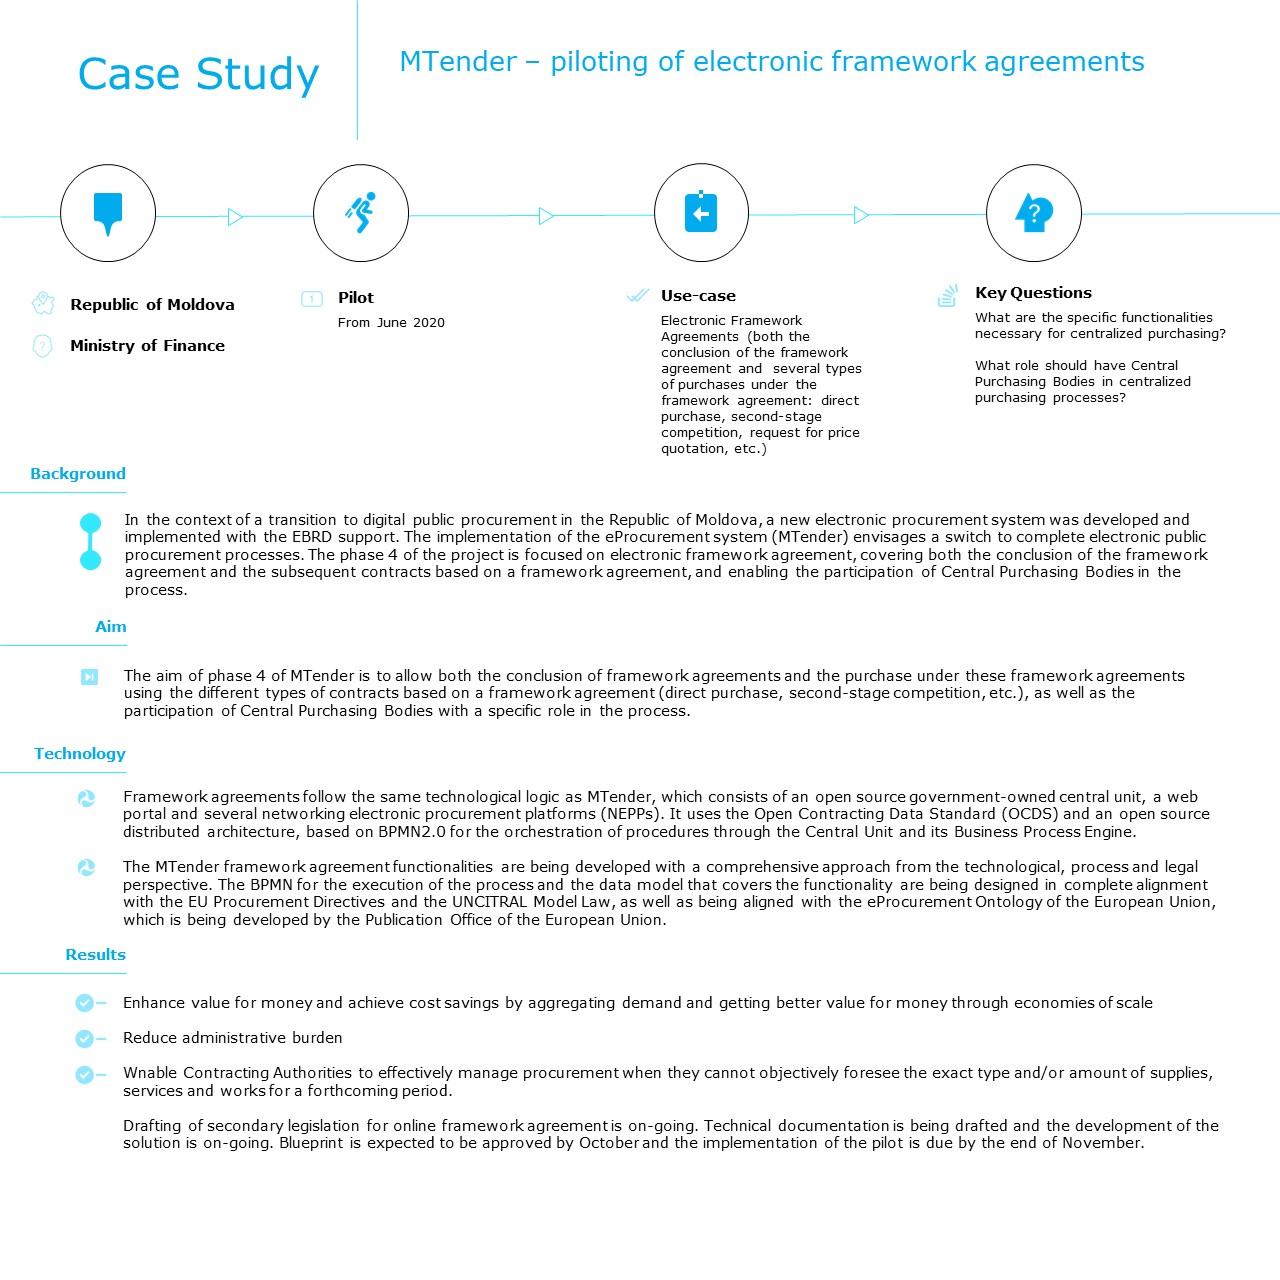
For more information: www.mtender.gov.md

COUNTRY DATA

CHIȘINĂU

CAPITAL

2,658,000

POPULATION

33,846SQ KM

AREA

MOLDOVAN LEU

CURRENCY

Incontent background image

HIGHLIGHTS

  • The Covid-19 crisis hit a stable but already decelerating economy. Economic activity plummeted in the second quarter of 2020 by 14 per cent year-on-year. However, the relatively good macroeconomic position before the crisis, and access to external financing, helped the economy to cope with the shock.
  • The authorities adopted a package of measures to safeguard the economy. These include tax deferrals, an increase in social benefits, monetary policy easing and measures to support liquidity in the banking sector.
  • Finalization of the new gas pipeline increases Moldova’s energy security. The inauguration of the Ungheni-Chisinau gas transmission pipeline, connecting the Moldovan gas network to the European Union via Romania, is an important step towards geographical diversification of energy supplies.

KEY PRIORITIES

  • Moldova should start preparing for opportunities from the expected post-Covid-19 shift in global value chains. One of the long-term consequences of the pandemic is expected to be the restructuring of global supply chains, and Moldova, with its geographical proximity to western Europe, should strengthen its position by pursuing long overdue structural reforms to improve the business environment.
  • The authorities should advance institutional reforms and improve governance. The success achieved in recent years in financial sector reform would not be sustainable without improvements in the rule of law and the fight against corruption. The creation of a level playing field, guaranteed by strong regulatory institutions, will be critical for investments.
  • The independence of the National Bank of Moldova (NBM) should be preserved. The continued strengthening of professional capacities of the NBM and respect for its institutional independence are the best guarantees of financial system stability.
Incontent background image

MAIN MACROECONOMIC INDICATORS %

PygalDomestic credit to private sector (% of GDP)0.07%Total reserves (% of total external debt)0.21%External debt stocks (% of GNI)0.36%Foreign direct investment, net inflows (% of GDP)0.50%Current account balance (% of GDP)0.64%Inflation, GDP deflator (annual %)0.79%GDP growth (annual %)0.93%0.00%20.00%40.00%60.00%29.50%213.50548439538127487.967032967033Domestic credit to private sector (% of GDP)36.36%239.30633081665107414.47802197802196Total reserves (% of total external debt)63.16%340.14914152222985340.98901098901104External debt stocks (% of GNI)4.16%118.18920755542929267.5Foreign direct investment, net inflows (% of GDP)-6.90%76.5660762293103194.01098901098902Current account balance (% of GDP)33.30%227.83107573075847120.52197802197799Inflation, GDP deflator (annual %)7.10%129.2458755313063547.03296703296709GDP growth (annual %)29.50%36.36%63.16%4.16%-6.90%33.30%7.10%
PygalDomestic credit to private sector (% of GDP)0.07%Total reserves (% of total external debt)0.21%External debt stocks (% of GNI)0.36%Foreign direct investment, net inflows (% of GDP)0.50%Current account balance (% of GDP)0.64%Inflation, GDP deflator (annual %)0.79%GDP growth (annual %)0.93%0.00%20.00%40.00%60.00%29.93%215.12613869922563487.967032967033Domestic credit to private sector (% of GDP)37.67%244.26054703166395414.47802197802196Total reserves (% of total external debt)58.02%320.80665781064846340.98901098901104External debt stocks (% of GNI)4.27%118.58561625927591267.5Foreign direct investment, net inflows (% of GDP)-10.12%64.44395094593484194.01098901098902Current account balance (% of GDP)8.19%133.3495556697493120.52197802197799Inflation, GDP deflator (annual %)5.82%124.4235072597666547.03296703296709GDP growth (annual %)29.93%37.67%58.02%4.27%-10.12%8.19%5.82%
PygalDomestic credit to private sector (% of GDP)0.07%Total reserves (% of total external debt)0.21%External debt stocks (% of GNI)0.36%Foreign direct investment, net inflows (% of GDP)0.50%Current account balance (% of GDP)0.64%Inflation, GDP deflator (annual %)0.79%GDP growth (annual %)0.93%0.00%20.00%40.00%60.00%33.70%229.3267164880458487.967032967033Domestic credit to private sector (% of GDP)47.27%280.3823428788358414.47802197802196Total reserves (% of total external debt)55.89%312.78972164585133340.98901098901104External debt stocks (% of GNI)2.88%113.36754230486159267.5Foreign direct investment, net inflows (% of GDP)-7.39%74.73270400146454194.01098901098902Current account balance (% of GDP)7.42%130.46562571341485120.52197802197799Inflation, GDP deflator (annual %)-0.59%100.3164357152089747.03296703296709GDP growth (annual %)33.70%47.27%55.89%2.88%-7.39%7.42%-0.59%
PygalDomestic credit to private sector (% of GDP)0.07%Total reserves (% of total external debt)0.21%External debt stocks (% of GNI)0.36%Foreign direct investment, net inflows (% of GDP)0.50%Current account balance (% of GDP)0.64%Inflation, GDP deflator (annual %)0.79%GDP growth (annual %)0.93%0.00%20.00%40.00%60.00%35.74%236.9735338747719487.967032967033Domestic credit to private sector (% of GDP)45.46%273.57532311237776414.47802197802196Total reserves (% of total external debt)59.71%327.1534895744622340.98901098901104External debt stocks (% of GNI)2.55%112.11707644539297267.5Foreign direct investment, net inflows (% of GDP)-5.16%83.1115689174222194.01098901098902Current account balance (% of GDP)3.92%117.29693208128003120.52197802197799Inflation, GDP deflator (annual %)9.04%136.5588639267836647.03296703296709GDP growth (annual %)35.74%45.46%59.71%2.55%-5.16%3.92%9.04%
PygalDomestic credit to private sector (% of GDP)0.07%Total reserves (% of total external debt)0.21%External debt stocks (% of GNI)0.36%Foreign direct investment, net inflows (% of GDP)0.50%Current account balance (% of GDP)0.64%Inflation, GDP deflator (annual %)0.79%GDP growth (annual %)0.93%0.00%20.00%40.00%60.00%31.05%219.33600227579456487.967032967033Domestic credit to private sector (% of GDP)36.86%241.20227134668838414.47802197802196Total reserves (% of total external debt)56.63%315.57133211208674340.98901098901104External debt stocks (% of GNI)3.63%116.18783926615272267.5Foreign direct investment, net inflows (% of GDP)-5.98%80.05405605177232194.01098901098902Current account balance (% of GDP)6.35%126.43252732681532120.52197802197799Inflation, GDP deflator (annual %)5.00%121.3440867866452647.03296703296709GDP growth (annual %)31.05%36.86%56.63%3.63%-5.98%6.35%5.00%
PygalDomestic credit to private sector (% of GDP)0.07%Total reserves (% of total external debt)0.21%External debt stocks (% of GNI)0.36%Foreign direct investment, net inflows (% of GDP)0.50%Current account balance (% of GDP)0.64%Inflation, GDP deflator (annual %)0.79%GDP growth (annual %)0.93%0.00%20.00%40.00%60.00%29.13%212.13591967292035487.967032967033Domestic credit to private sector (% of GDP)28.77%210.76582280342416414.47802197802196Total reserves (% of total external debt)74.52%382.8792328542748340.98901098901104External debt stocks (% of GNI)2.91%113.49141858040784267.5Foreign direct investment, net inflows (% of GDP)-5.98%80.0535721309148194.01098901098902Current account balance (% of GDP)9.56%138.51702987122735120.52197802197799Inflation, GDP deflator (annual %)-0.34%101.2625957849312647.03296703296709GDP growth (annual %)29.13%28.77%74.52%2.91%-5.98%9.56%-0.34%
PygalDomestic credit to private sector (% of GDP)0.07%Total reserves (% of total external debt)0.21%External debt stocks (% of GNI)0.36%Foreign direct investment, net inflows (% of GDP)0.50%Current account balance (% of GDP)0.64%Inflation, GDP deflator (annual %)0.79%GDP growth (annual %)0.93%0.00%20.00%40.00%60.00%25.55%198.66461867852883487.967032967033Domestic credit to private sector (% of GDP)35.38%235.63221801496888414.47802197802196Total reserves (% of total external debt)73.21%377.9390606183862340.98901098901104External debt stocks (% of GNI)1.10%106.65488972779325267.5Foreign direct investment, net inflows (% of GDP)-3.50%89.37717252004371194.01098901098902Current account balance (% of GDP)5.67%123.88146158987664120.52197802197799Inflation, GDP deflator (annual %)4.41%119.1216761948489747.03296703296709GDP growth (annual %)25.55%35.38%73.21%1.10%-3.50%5.67%4.41%
PygalDomestic credit to private sector (% of GDP)0.07%Total reserves (% of total external debt)0.21%External debt stocks (% of GNI)0.36%Foreign direct investment, net inflows (% of GDP)0.50%Current account balance (% of GDP)0.64%Inflation, GDP deflator (annual %)0.79%GDP growth (annual %)0.93%0.00%20.00%40.00%60.00%22.76%188.1678638986538487.967032967033Domestic credit to private sector (% of GDP)40.12%253.4522504648659414.47802197802196Total reserves (% of total external debt)68.37%359.7470528763215340.98901098901104External debt stocks (% of GNI)1.55%108.35224323218368267.5Foreign direct investment, net inflows (% of GDP)-5.73%80.96108890561253194.01098901098902Current account balance (% of GDP)6.25%126.04915115027947120.52197802197799Inflation, GDP deflator (annual %)4.69%120.1822332576923247.03296703296709GDP growth (annual %)22.76%40.12%68.37%1.55%-5.73%6.25%4.69%
PygalDomestic credit to private sector (% of GDP)0.07%Total reserves (% of total external debt)0.21%External debt stocks (% of GNI)0.36%Foreign direct investment, net inflows (% of GDP)0.50%Current account balance (% of GDP)0.64%Inflation, GDP deflator (annual %)0.79%GDP growth (annual %)0.93%0.00%20.00%40.00%60.00%23.22%189.89208868769933487.967032967033Domestic credit to private sector (% of GDP)40.20%253.76829358607486414.47802197802196Total reserves (% of total external debt)62.05%335.98840420245494340.98901098901104External debt stocks (% of GNI)2.52%112.01488940328633267.5Foreign direct investment, net inflows (% of GDP)-10.35%63.59453032404013194.01098901098902Current account balance (% of GDP)3.18%114.49858617578923120.52197802197799Inflation, GDP deflator (annual %)4.30%118.7175943144862647.03296703296709GDP growth (annual %)23.22%40.20%62.05%2.52%-10.35%3.18%4.30%
PygalDomestic credit to private sector (% of GDP)0.07%Total reserves (% of total external debt)0.21%External debt stocks (% of GNI)0.36%Foreign direct investment, net inflows (% of GDP)0.50%Current account balance (% of GDP)0.64%Inflation, GDP deflator (annual %)0.79%GDP growth (annual %)0.93%0.00%20.00%40.00%60.00%24.83%195.95234394251207487.967032967033Domestic credit to private sector (% of GDP)40.60%255.27002632650613414.47802197802196Total reserves (% of total external debt)59.86%327.741152994985340.98901098901104External debt stocks (% of GNI)4.19%118.30200607591817267.5Foreign direct investment, net inflows (% of GDP)-9.35%67.35971167314443194.01098901098902Current account balance (% of GDP)5.49%123.19393482091964120.52197802197799Inflation, GDP deflator (annual %)3.58%116.0051550323611647.03296703296709GDP growth (annual %)24.83%40.60%59.86%4.19%-9.35%5.49%3.58%

LOCAL EXPERTS

Collapse arrow image
Person's picture
Dorina Jitaru