WHERE WE WORK

UKRAINE

OVERVIEW

Case studies Country data Macroeconomic indicators

MAJOR STRUCTURAL REFORM DEVELOPMENTS

Collapse arrow image

The bank resolution mechanism was significantly strengthened.
A number of legal amendments, adopted by parliament in May 2020, aim to address regulatory gaps found during the banking sector clean-up in recent years and to ring-fence the decisions taken by the regulator. The law guarantees irreversibility of bank resolution as decided by the NBU by preventing the court from challenging the liquidation procedure, sale of assets and settlements with the bank’s creditors. Further, it changes the procedure for courts to contest decisions by the regulators, namely the NBU, the cabinet of ministers and the Deposit Guarantee Fund, as it restricts the possibility of questioning their technical expertise and judgements. In cases where compensation to the previous owners is warranted, the law stipulates the exact conditions, processes and type of compensation, with the key role given to internationally acknowledged audit firms as unbiased experts. The reform also strengthens the early intervention framework and entry into resolution, and sets clear guidelines for potential nationalization.


Reforms in the gas sector have advanced, but there were reform reversals in the renewables sector.
At the end of 2019 gas production operations of the national oil and gas company, Naftogaz, were separated from gas transmission. The latter was moved to a new state-owned independent pipeline operator. The creation of an independent gas transmission system operator enabled the signing of a new five-year transit contract with Gazprom Russia at the end of 2019. The legislation pertaining to Naftogaz’s unbundling was reviewed by the Energy Community and is deemed in line with Ukraine’s obligations under the European Third Energy Package. After household gas prices were liberalized in January 2019 and the Public Service Obligation Order for the supply of gas to households was terminated in July 2020, household gas prices are now fully market-determined. However, long negotiations between the government, private sector and international development partners on restructuring the feed-in tariff mechanism for renewables in Ukraine did not lead to a consensus. In July 2020 parliament approved the reduction in the feed-in tariffs, thus changing the framework conditions for investing in renewables. While the main motivation was to decrease the burden on the state’s finances, the forced retroactive changes will impair the investors’ legitimate interests and may lead to litigation, with potentially serious future fiscal implications.


The longstanding moratorium on the sale of agricultural land was lifted, albeit with limitations.
In March 2020 parliament adopted a new law on the market circulation of agricultural land, which comes into effect in July 2021. A large number of limitations in the legislation put a tight cap on the productivity gains expected to be realized. In particular, the embargo on the participation of foreign persons and entities remains in place and can be lifted only on approval by a national referendum. The sale of state land also continues to be banned. Among other notable limitations, the law imposes an upper limit on the amount of agricultural land that can be owned by a citizen or legal entity, with the latter being able to make purchases from 2024.


Parliament re-criminalized illicit enrichment.
The law on the prevention and punishment of revenues embezzled by public servants was originally approved in 2015 before it was overturned by a controversial Constitutional Court ruling in February 2019. Approved in November 2019, the current bill envisages filing criminal charges if public officials’ assets, as stated in the asset declaration, exceed their official income by a certain amount. However, in October 2020 the Constitutional Court undermined the fundamentals of the anti-corruption reform by overturning the system of electronic declaration of assets and income of state officials and decriminalizing the act of knowingly submitting fraudulent declarations.


A new law on concessions sets up a clear legal framework for this form of public-private partnership.
Adopted and effective in the last quarter of 2019, the law replaces previous outdated regulations. A clear regulatory framework for concession activities is conducive to attracting investment and upgrading infrastructure. In June and August 2020, the new framework was successfully implemented in the selection and contraction of concessioners of two Black Sea ports.


New wage caps in state-owned institutions may hinder future governance improvements.
In April 2020 the authorities introduced a cap on salaries of all public employees as well as top management and supervisory board members of state-owned enterprises (SOEs) and state-owned banks (SOBs) to match more closely average salaries in the country. The cap was introduced as a temporary emergency measure and it was removed for judges, prosecutors, members of parliament and members of the board of the National Bank of Ukraine in August 2020, and for the managers of state banks in September 2020. However, it stays in place for the board members of SOEs and SOBs, thus risking having a long-term detrimental effect on the ability to attract and retain leaders of appropriate quality and experience at institutions of systemic importance for the country.


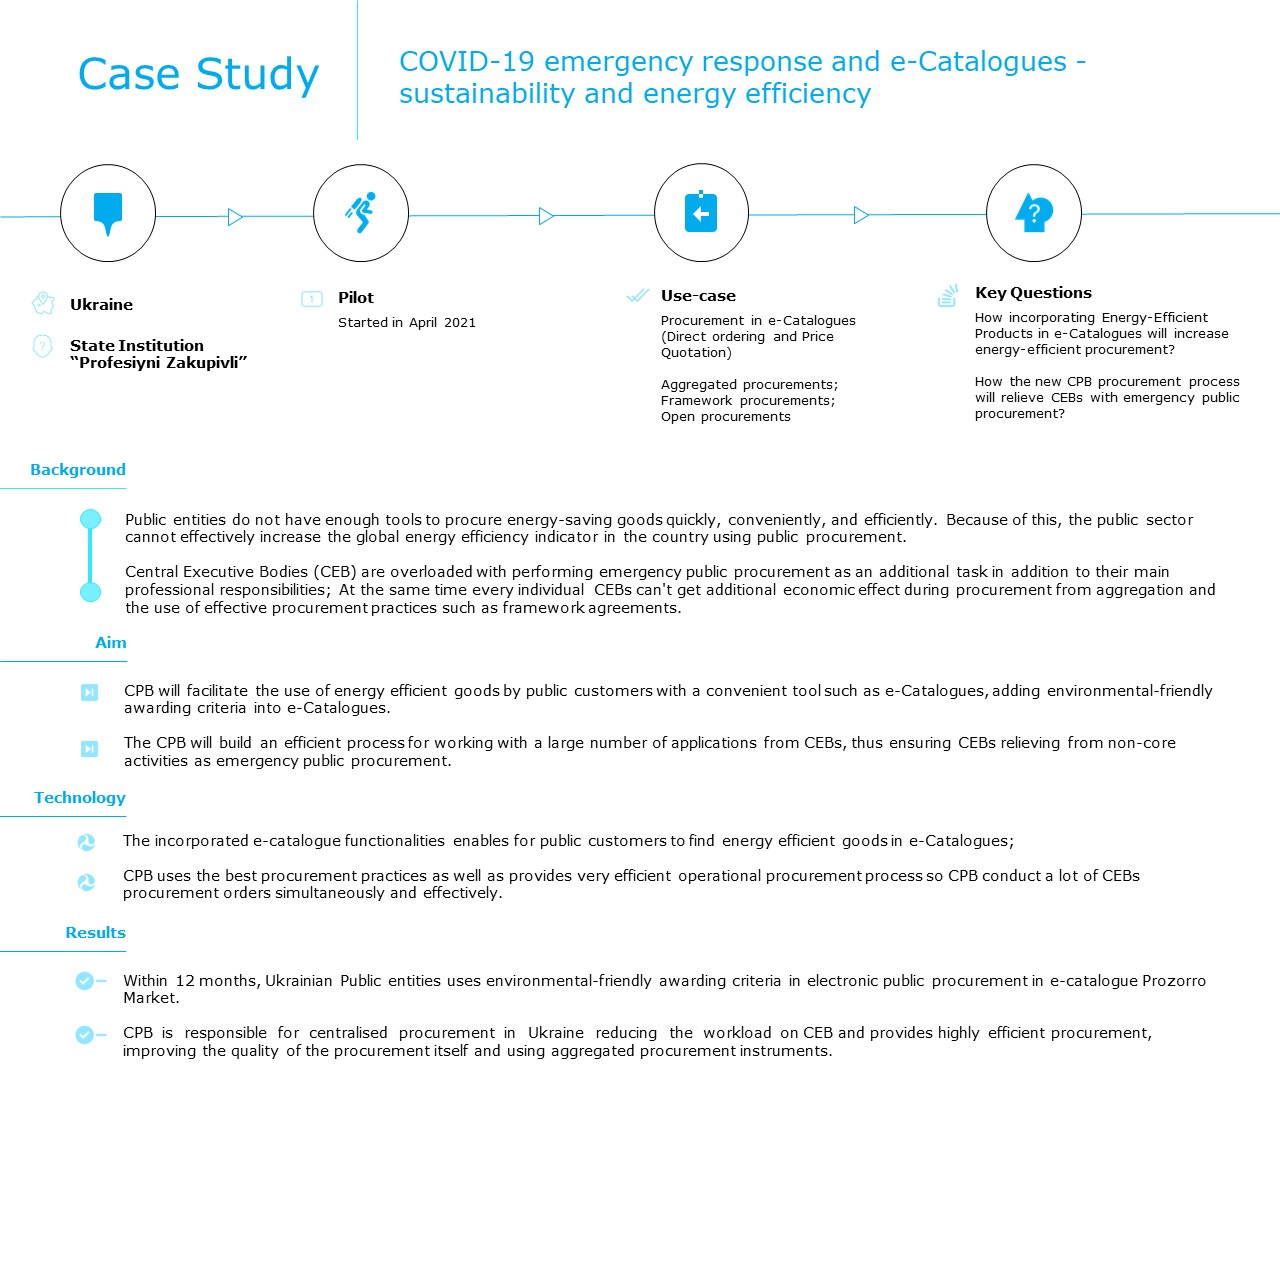
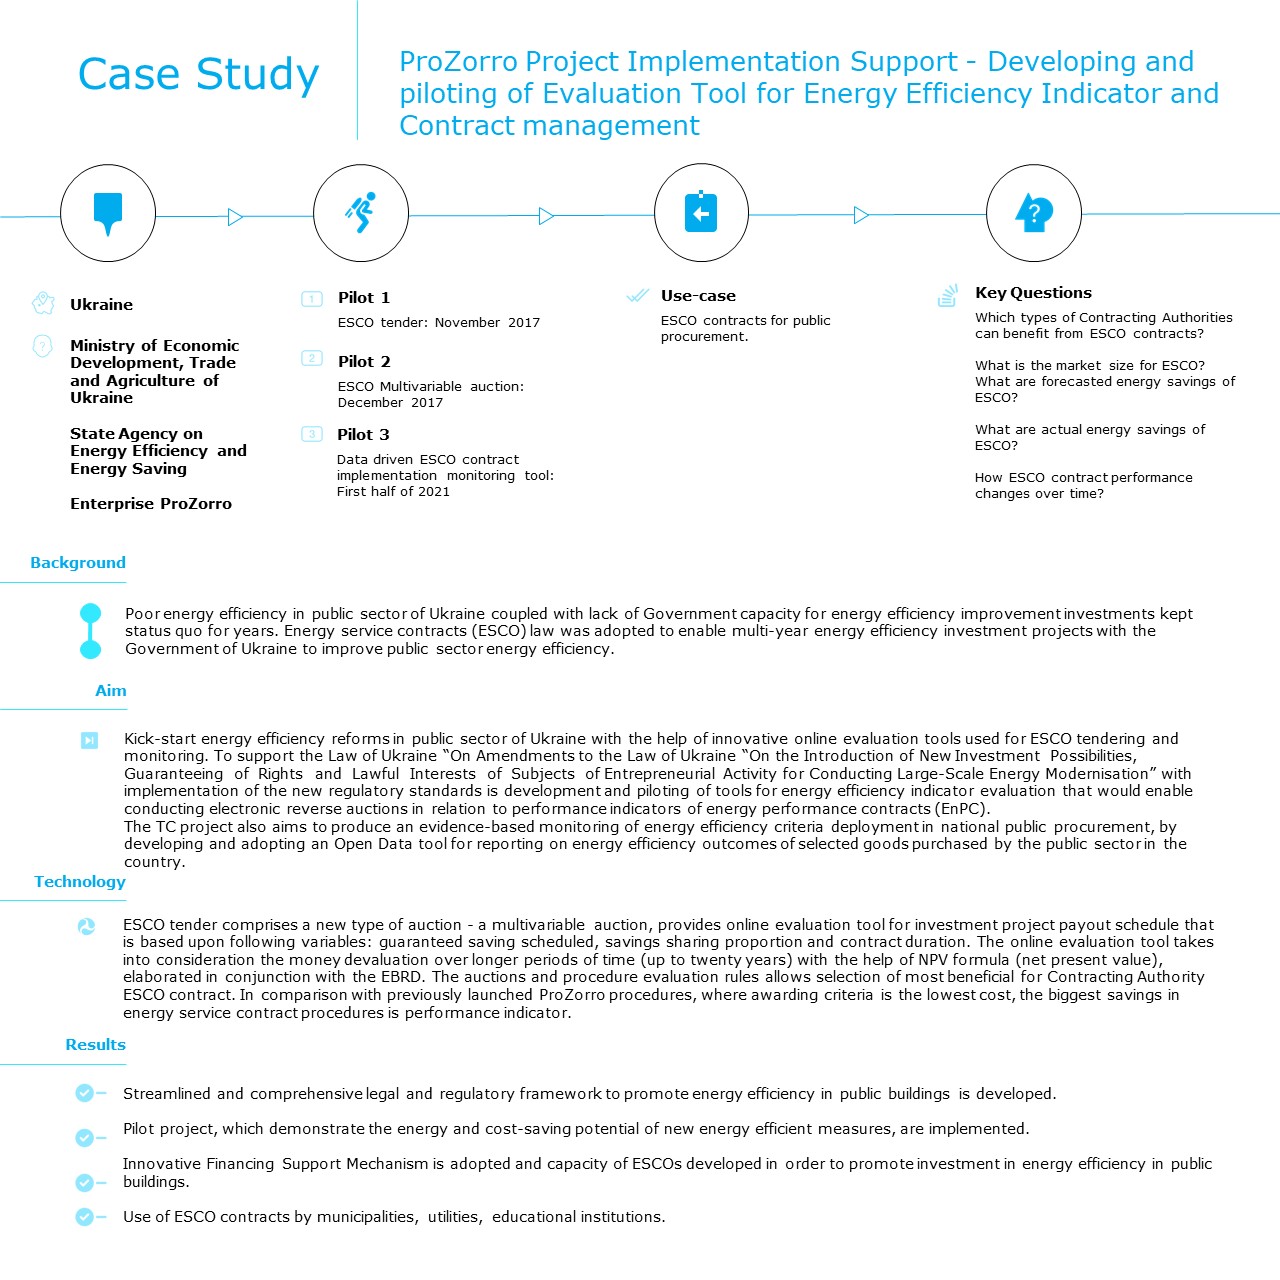
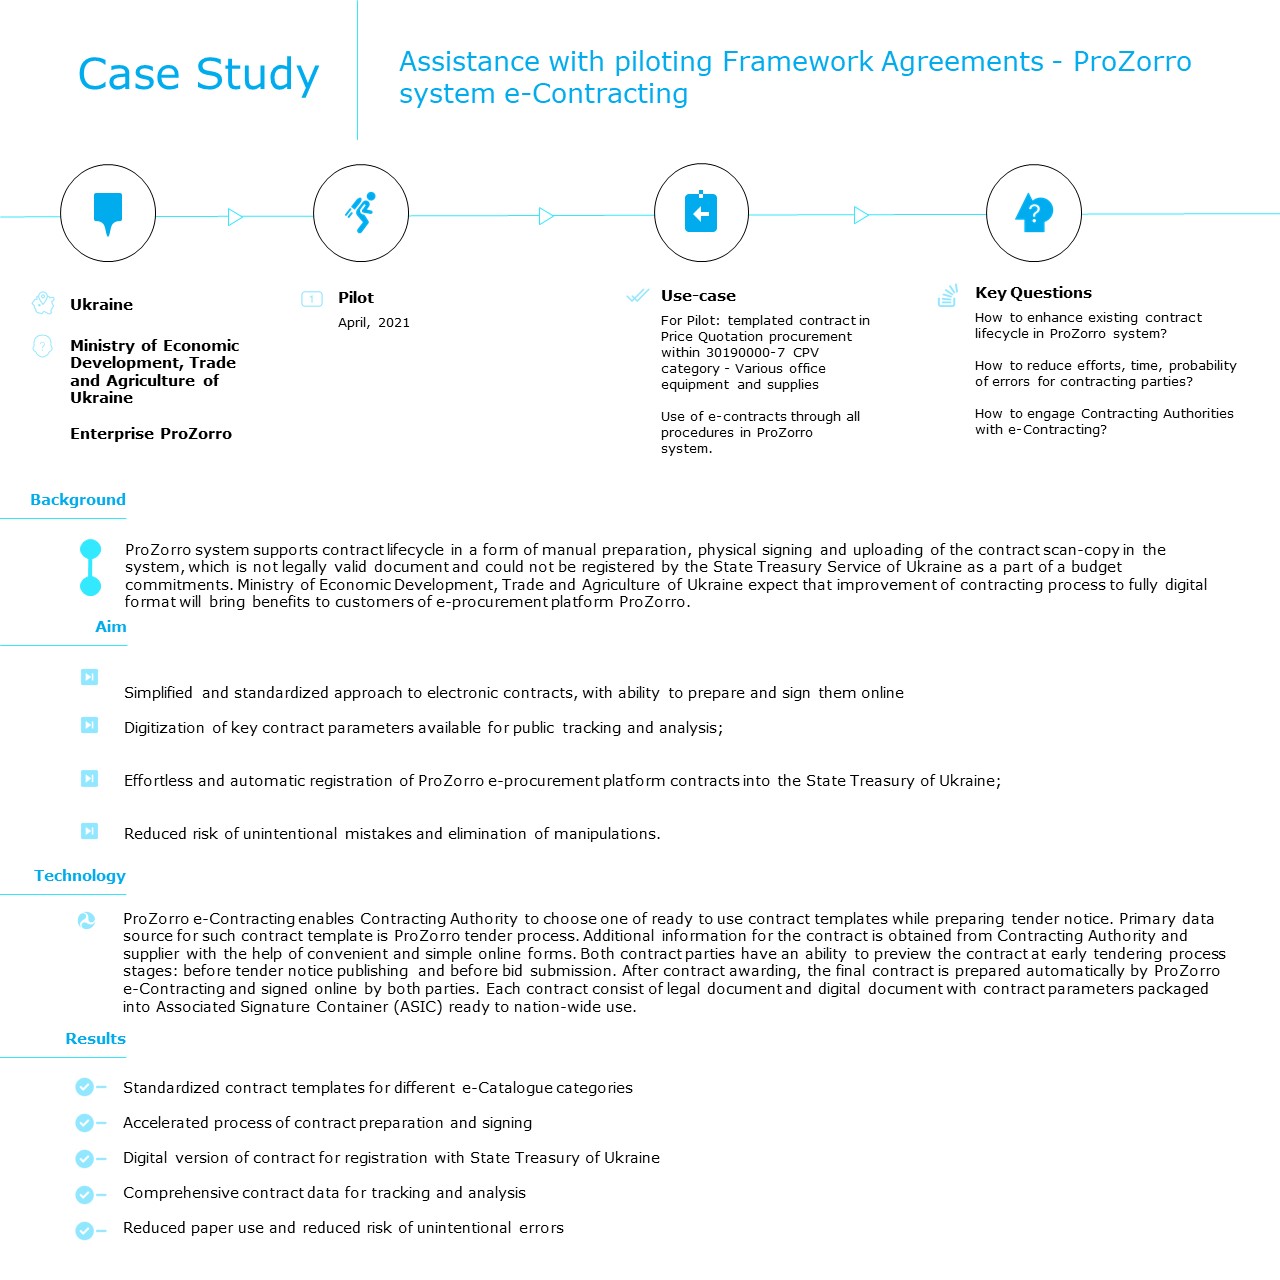
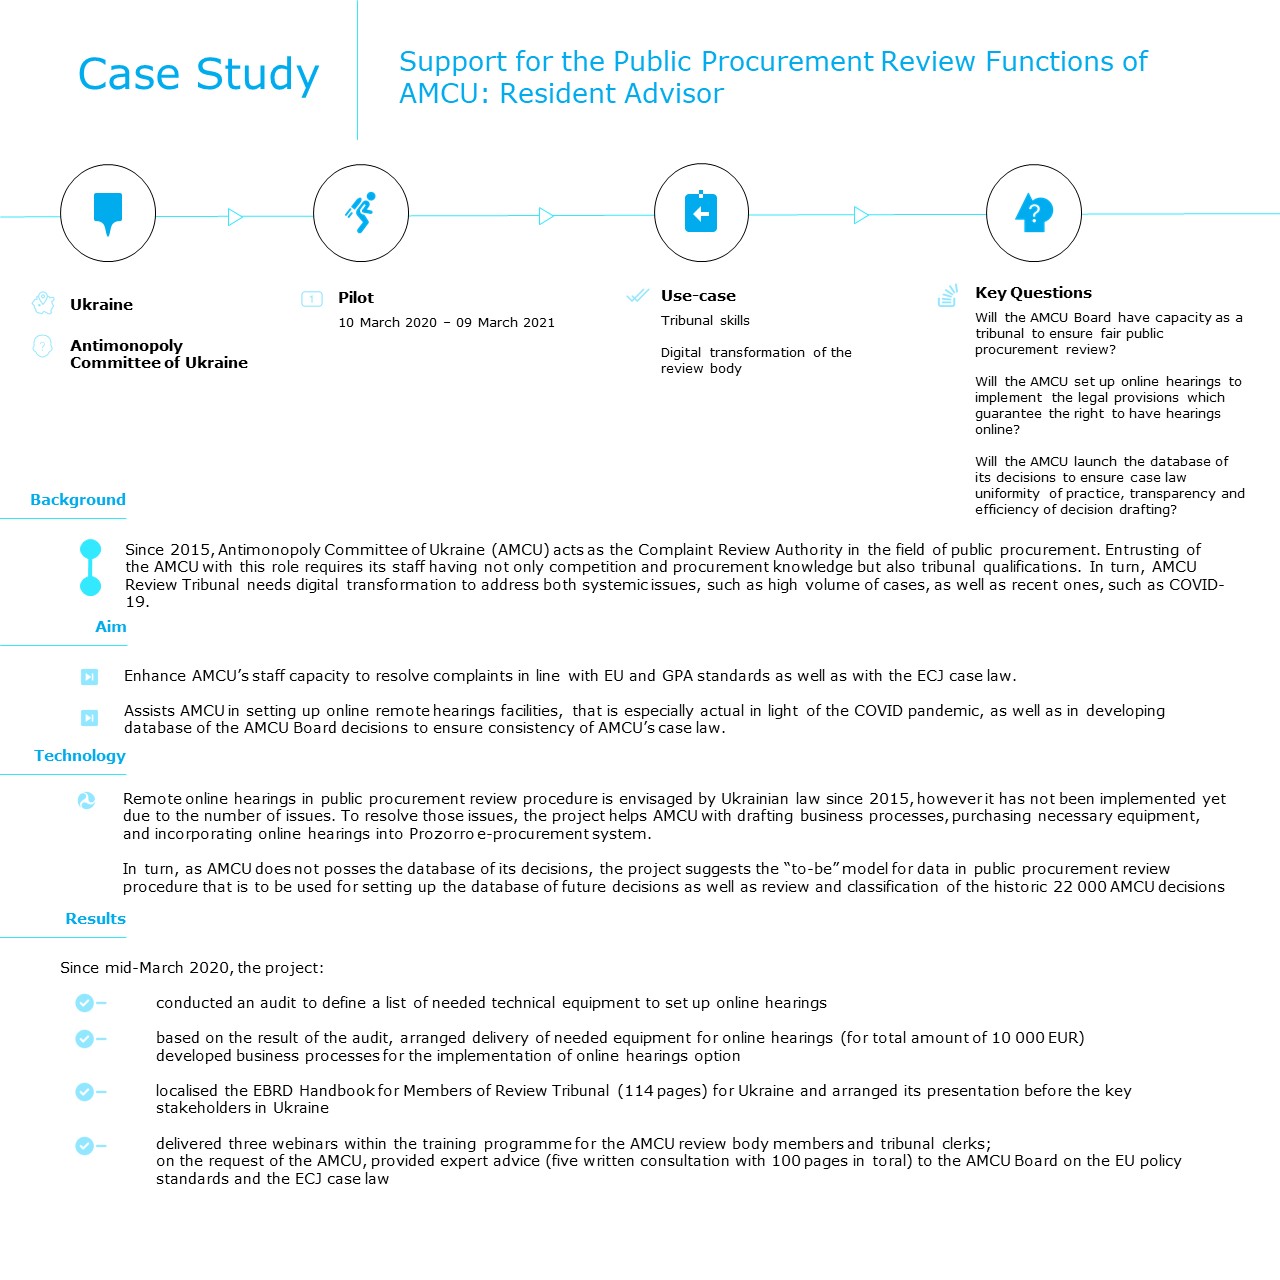
CASE STUDIES

Collapse arrow image

COUNTRY DATA

KYIV

CAPITAL

44,390,000

POPULATION

603,628SQ KM

AREA

UKRAINIAN HRYVNIA

CURRENCY

Incontent background image

HIGHLIGHTS

  • Structural weaknesses weighed on economic growth even before Covid-19. GDP declined by 1.3 per cent year-on-year in the first quarter of 2020 before plunging by 4 per cent year-on-year in the second quarter, as the pandemic took its toll on the economy.
  • A new International Monetary Fund (IMF) programme has been approved. Approval of the 18-month, US$ 5.0 billion Stand-By Arrangement in June 2020 helped ease immediate funding pressures, and the implementation of certain prior conditions unleashed the necessary external financing.
  • Progress in energy sector reform has been mixed. The long-awaited Naftogaz unbundling will improve Ukraine’s energy resilience, but a forced retroactive reduction in feed-in tariffs for renewables could damage investor confidence.

KEY PRIORITIES

  • Preserving the independence of the National Bank of Ukraine (NBU) is vital for macroeconomic stability and maintaining access to external funding. Strategic and operational decisions undertaken by the NBU, as regulator of the financial system, need to be governed exclusively by sound principles of macroeconomic policymaking and supervisory prudence.
  • Progress is needed in key areas of governance. While the authorities have successfully implemented legal changes in many areas over the past years, they should push forward with privatization, judicial reform, public administration reform and digitalization of public sector services.
  • The lack of meaningful progress in the fight against corruption needs to be addressed. More than five years after the Revolution of Dignity, widespread corruption continues to be among the main impediments to doing business in Ukraine.
Incontent background image

MAIN MACROECONOMIC INDICATORS %

PygalDomestic credit to private sector (% of GDP)0.07%Total reserves (% of total external debt)0.21%External debt stocks (% of GNI)0.36%Foreign direct investment, net inflows (% of GDP)0.50%Current account balance (% of GDP)0.64%Inflation, GDP deflator (annual %)0.79%GDP growth (annual %)0.93%0.00%20.00%40.00%60.00%80.00%78.65%325.1132599939071487.967032967033Domestic credit to private sector (% of GDP)27.76%181.9614667128588414.47802197802196Total reserves (% of total external debt)92.93%365.2911889134706340.98901098901104External debt stocks (% of GNI)4.74%117.20174468663487267.5Foreign direct investment, net inflows (% of GDP)-2.22%97.6202249236106194.01098901098902Current account balance (% of GDP)13.92%143.02582378201745120.52197802197799Inflation, GDP deflator (annual %)3.83%114.6457808382332447.03296703296709GDP growth (annual %)78.65%27.76%92.93%4.74%-2.22%13.92%3.83%
PygalDomestic credit to private sector (% of GDP)0.07%Total reserves (% of total external debt)0.21%External debt stocks (% of GNI)0.36%Foreign direct investment, net inflows (% of GDP)0.50%Current account balance (% of GDP)0.64%Inflation, GDP deflator (annual %)0.79%GDP growth (annual %)0.93%0.00%20.00%40.00%60.00%80.00%71.08%303.8134173151005487.967032967033Domestic credit to private sector (% of GDP)23.18%169.07288620391472414.47802197802196Total reserves (% of total external debt)86.05%345.9450435294785340.98901098901104External debt stocks (% of GNI)4.42%116.28523548427759267.5Foreign direct investment, net inflows (% of GDP)-6.27%86.2141854150075194.01098901098902Current account balance (% of GDP)14.20%143.80958667733535120.52197802197799Inflation, GDP deflator (annual %)5.47%119.2345690150464747.03296703296709GDP growth (annual %)71.08%23.18%86.05%4.42%-6.27%14.20%5.47%
PygalDomestic credit to private sector (% of GDP)0.07%Total reserves (% of total external debt)0.21%External debt stocks (% of GNI)0.36%Foreign direct investment, net inflows (% of GDP)0.50%Current account balance (% of GDP)0.64%Inflation, GDP deflator (annual %)0.79%GDP growth (annual %)0.93%0.00%20.00%40.00%60.00%80.00%69.58%299.6053043151217487.967032967033Domestic credit to private sector (% of GDP)18.36%155.50388733855124414.47802197802196Total reserves (% of total external debt)77.39%321.5866325448413340.98901098901104External debt stocks (% of GNI)4.65%116.94218945950672267.5Foreign direct investment, net inflows (% of GDP)-8.16%80.91606346725465194.01098901098902Current account balance (% of GDP)7.79%125.7879122749186120.52197802197799Inflation, GDP deflator (annual %)0.24%104.5299935527878447.03296703296709GDP growth (annual %)69.58%18.36%77.39%4.65%-8.16%7.79%0.24%
PygalDomestic credit to private sector (% of GDP)0.07%Total reserves (% of total external debt)0.21%External debt stocks (% of GNI)0.36%Foreign direct investment, net inflows (% of GDP)0.50%Current account balance (% of GDP)0.64%Inflation, GDP deflator (annual %)0.79%GDP growth (annual %)0.93%0.00%20.00%40.00%60.00%80.00%73.46%310.5325298306289487.967032967033Domestic credit to private sector (% of GDP)13.92%143.02310760407795414.47802197802196Total reserves (% of total external debt)81.34%332.68991246131156340.98901098901104External debt stocks (% of GNI)2.46%110.77855297476688267.5Foreign direct investment, net inflows (% of GDP)-9.01%78.50804911776697194.01098901098902Current account balance (% of GDP)4.34%116.05972020548963120.52197802197799Inflation, GDP deflator (annual %)-0.03%103.7834030019805647.03296703296709GDP growth (annual %)73.46%13.92%81.34%2.46%-9.01%4.34%-0.03%
PygalDomestic credit to private sector (% of GDP)0.07%Total reserves (% of total external debt)0.21%External debt stocks (% of GNI)0.36%Foreign direct investment, net inflows (% of GDP)0.50%Current account balance (% of GDP)0.64%Inflation, GDP deflator (annual %)0.79%GDP growth (annual %)0.93%0.00%20.00%40.00%60.00%80.00%75.23%315.499282289701487.967032967033Domestic credit to private sector (% of GDP)5.94%120.58261441132042414.47802197802196Total reserves (% of total external debt)96.09%374.19605692269596340.98901098901104External debt stocks (% of GNI)0.63%105.6433794896245267.5Foreign direct investment, net inflows (% of GDP)-3.44%94.17344580547146194.01098901098902Current account balance (% of GDP)15.90%148.59499931784865120.52197802197799Inflation, GDP deflator (annual %)-6.55%85.4240414961563547.03296703296709GDP growth (annual %)75.23%5.94%96.09%0.63%-3.44%15.90%-6.55%
PygalDomestic credit to private sector (% of GDP)0.07%Total reserves (% of total external debt)0.21%External debt stocks (% of GNI)0.36%Foreign direct investment, net inflows (% of GDP)0.50%Current account balance (% of GDP)0.64%Inflation, GDP deflator (annual %)0.79%GDP growth (annual %)0.93%0.00%20.00%40.00%60.00%80.00%56.66%263.25336415065664487.967032967033Domestic credit to private sector (% of GDP)11.32%135.7182483112979414.47802197802196Total reserves (% of total external debt)128.49%465.3462607496231340.98901098901104External debt stocks (% of GNI)-0.41%102.71812518237559267.5Foreign direct investment, net inflows (% of GDP)5.53%119.4190744210043194.01098901098902Current account balance (% of GDP)38.88%213.2439475684339120.52197802197799Inflation, GDP deflator (annual %)-9.77%76.3643116853904247.03296703296709GDP growth (annual %)56.66%11.32%128.49%-0.41%5.53%38.88%-9.77%
PygalDomestic credit to private sector (% of GDP)0.07%Total reserves (% of total external debt)0.21%External debt stocks (% of GNI)0.36%Foreign direct investment, net inflows (% of GDP)0.50%Current account balance (% of GDP)0.64%Inflation, GDP deflator (annual %)0.79%GDP growth (annual %)0.93%0.00%20.00%40.00%60.00%80.00%47.31%236.94732079597168487.967032967033Domestic credit to private sector (% of GDP)13.51%141.86877122522174414.47802197802196Total reserves (% of total external debt)121.26%445.00735334152614340.98901098901104External debt stocks (% of GNI)4.25%115.81310871913064267.5Foreign direct investment, net inflows (% of GDP)-2.00%98.23530111673868194.01098901098902Current account balance (% of GDP)17.33%152.62126931371705120.52197802197799Inflation, GDP deflator (annual %)2.24%110.1464116400526947.03296703296709GDP growth (annual %)47.31%13.51%121.26%4.25%-2.00%17.33%2.24%
PygalDomestic credit to private sector (% of GDP)0.07%Total reserves (% of total external debt)0.21%External debt stocks (% of GNI)0.36%Foreign direct investment, net inflows (% of GDP)0.50%Current account balance (% of GDP)0.64%Inflation, GDP deflator (annual %)0.79%GDP growth (annual %)0.93%0.00%20.00%40.00%60.00%80.00%38.27%211.52622142520153487.967032967033Domestic credit to private sector (% of GDP)15.33%146.99430255438156414.47802197802196Total reserves (% of total external debt)106.90%404.58830885502044340.98901098901104External debt stocks (% of GNI)3.49%113.68331484084068267.5Foreign direct investment, net inflows (% of GDP)-3.10%95.14959408644762194.01098901098902Current account balance (% of GDP)22.08%165.97758566228708120.52197802197799Inflation, GDP deflator (annual %)2.47%110.7961922700288347.03296703296709GDP growth (annual %)38.27%15.33%106.90%3.49%-3.10%22.08%2.47%
PygalDomestic credit to private sector (% of GDP)0.07%Total reserves (% of total external debt)0.21%External debt stocks (% of GNI)0.36%Foreign direct investment, net inflows (% of GDP)0.50%Current account balance (% of GDP)0.64%Inflation, GDP deflator (annual %)0.79%GDP growth (annual %)0.93%0.00%20.00%40.00%60.00%80.00%34.51%200.94245873136794487.967032967033Domestic credit to private sector (% of GDP)17.20%152.24499761812942414.47802197802196Total reserves (% of total external debt)90.16%357.5049769937509340.98901098901104External debt stocks (% of GNI)3.50%113.69307662647329267.5Foreign direct investment, net inflows (% of GDP)-4.91%90.0351029397448194.01098901098902Current account balance (% of GDP)15.40%147.1775798876967120.52197802197799Inflation, GDP deflator (annual %)3.41%113.4386138222409747.03296703296709GDP growth (annual %)34.51%17.20%90.16%3.50%-4.91%15.40%3.41%
PygalDomestic credit to private sector (% of GDP)0.07%Total reserves (% of total external debt)0.21%External debt stocks (% of GNI)0.36%Foreign direct investment, net inflows (% of GDP)0.50%Current account balance (% of GDP)0.64%Inflation, GDP deflator (annual %)0.79%GDP growth (annual %)0.93%0.00%20.00%40.00%60.00%80.00%30.05%188.38943079617968487.967032967033Domestic credit to private sector (% of GDP)20.44%161.37023237212185414.47802197802196Total reserves (% of total external debt)78.12%323.62587791024976340.98901098901104External debt stocks (% of GNI)3.79%114.5294853621626267.5Foreign direct investment, net inflows (% of GDP)-2.68%96.31400757604747194.01098901098902Current account balance (% of GDP)8.13%126.73056655797005120.52197802197799Inflation, GDP deflator (annual %)3.23%112.9552694852723247.03296703296709GDP growth (annual %)30.05%20.44%78.12%3.79%-2.68%8.13%3.23%